Marble Minotaur
→ marble-report.html

A real report, read step by step.

On 23 September 2026, Marble Minotaur audited the demo instance of Granit Golem, a monitoring application built with Vue, using a test account. 60 screens opened in 16 min 58 s. Granit Golem is another of my projects: I say so because a sample picked by the author should be picked openly. Nothing was touched up, neither the application before nor the report after. Here is what a team receives, in the order they read it. The report itself is written in French; quotes are translated.

Open the full report (in French)

The real file, as a team receives it (6.9 MB). Light version: no HTTP headers, responses or screenshots.

Episode · From finding to fix · 45 s Too much noise, the same defects a hundred times: how the report brings them down to a list of fixes. Narration in French.
→ Summary

“Can we ship?”

The verdict first, and what it covers.

The summary opens on one sentence: two blocking failures, observed on the 60 audited screens. Right below, what this verdict cannot say: the run was read only, so no command was triggered and no journey replayed.

A verdict that hides its limits reads like a guarantee. This one writes them down.
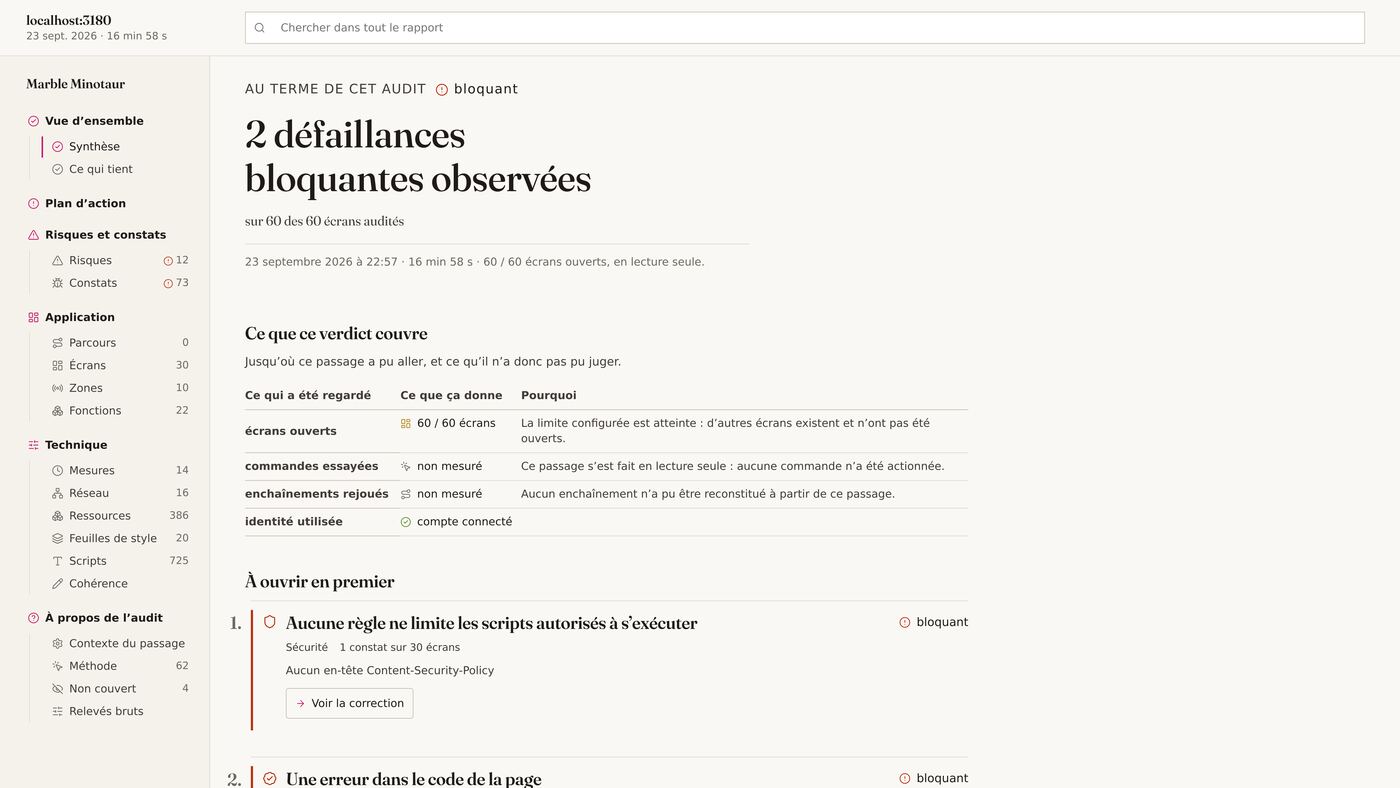
Summary: 2 blocking failures observed on 60 of the 60 audited screens, and a table of what the verdict covers
At the end of this audit: blocking. Commands tried: not measured. Journeys replayed: not measured.
→ Risks

“What can actually happen to us?”

One risk, end to end.

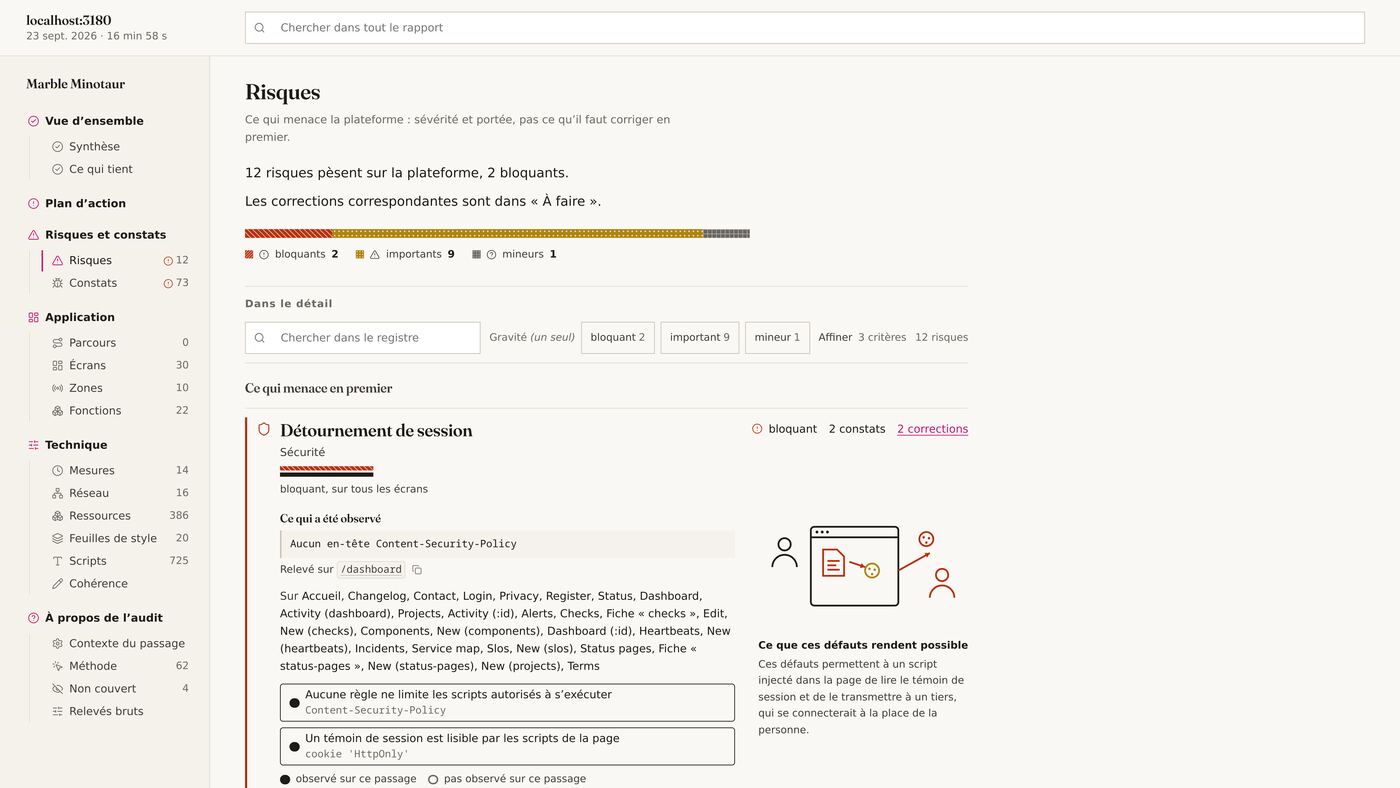
Two defects, taken separately, look technical. Together, they open a door. The report links them into one named risk, says where it was seen, and explains in one sentence what it would allow.

blocking Session hijack

Security · on every screen · 2 findings · 2 fixes

Observed: no rule limits which scripts may run (Content-Security-Policy), seen on /dashboard and the 29 other screens; a session cookie is readable by page scripts (HttpOnly missing).

What these defects make possible: a script injected into the page reads the session cookie and sends it to a third party, who could then sign in as that person.

Risks tab: the Session hijack risk card, with its diagram
→ To do

“Where do we start on Monday?”

68 fixes, the most worthwhile first.

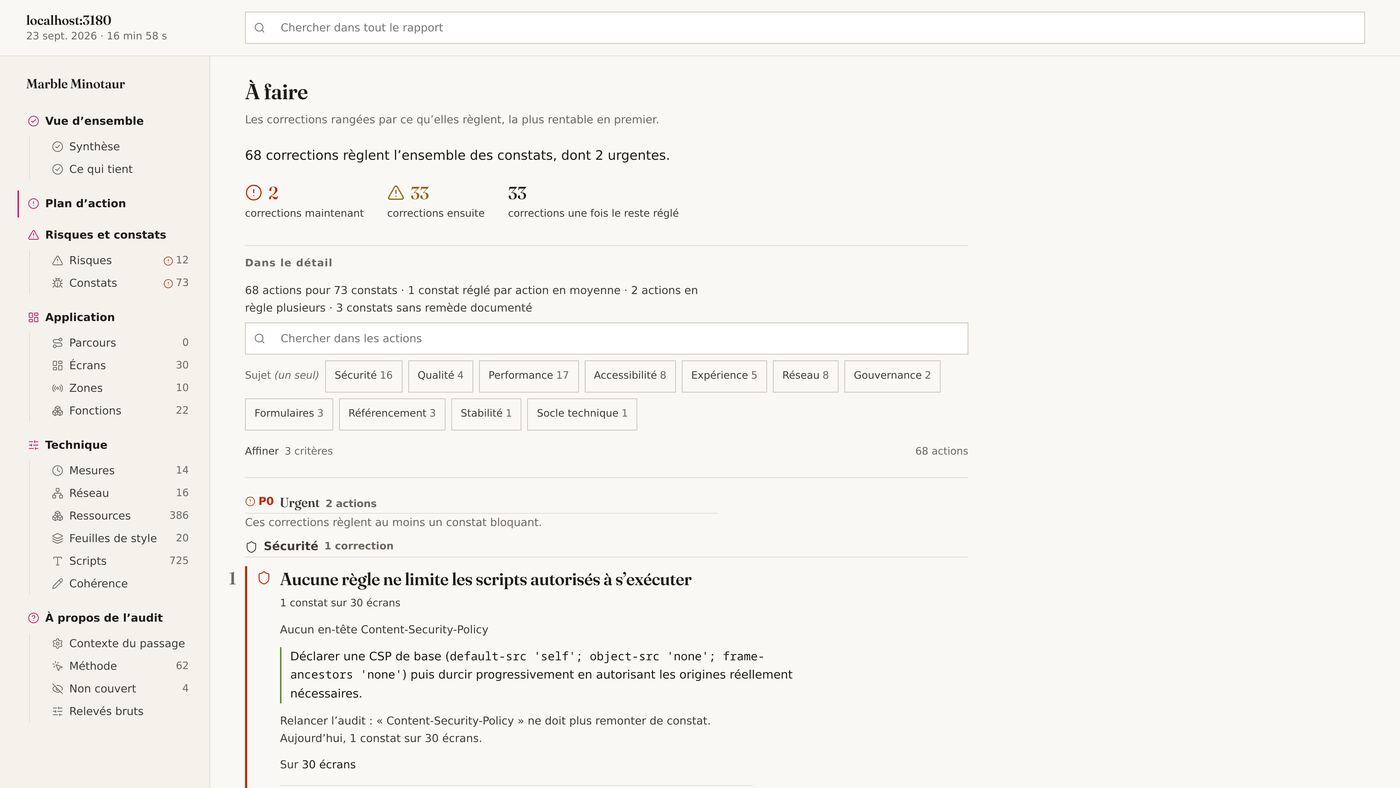
73 findings come down to 68 fixes: 2 now, 33 next, 33 once the rest is done. Each says how many screens it repairs, what to do, and how to check it is done.

urgent No rule limits which scripts may run

1 finding across 30 screens · Security

Do: declare a baseline policy (default-src 'self'; object-src 'none'; frame-ancestors 'none'), then tighten it by allowing only the origins you actually need.

Check: run the audit again; “Content-Security-Policy” should no longer raise a finding.

To do tab: 68 fixes, 2 now, 33 next, 33 once the rest is done
→ What holds

“What works, at least?”

What holds, said just as clearly.

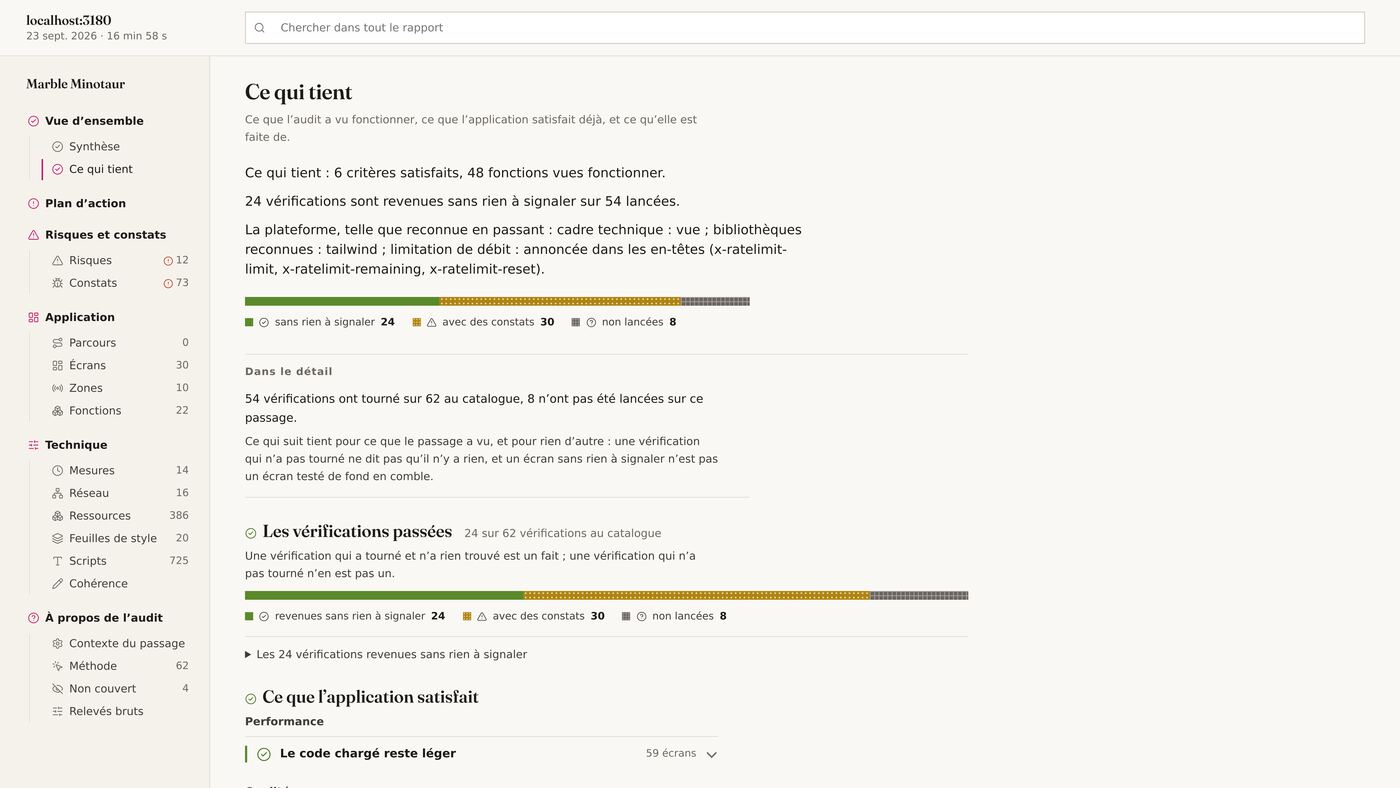
48 functions seen working, 6 criteria met, 24 checks back with nothing to report out of 54 run. The platform recognised along the way: Vue, Tailwind, rate limiting announced in the headers.

And the nuance that makes the difference: a check that did not run does not mean there is nothing. The 8 checks not run are counted apart, never among the passes.

What holds tab: 6 criteria met, 48 functions seen working, 24 checks with nothing to report out of 54
→ Functions

“What does our application really do?”

The map of functions, without reading the code.

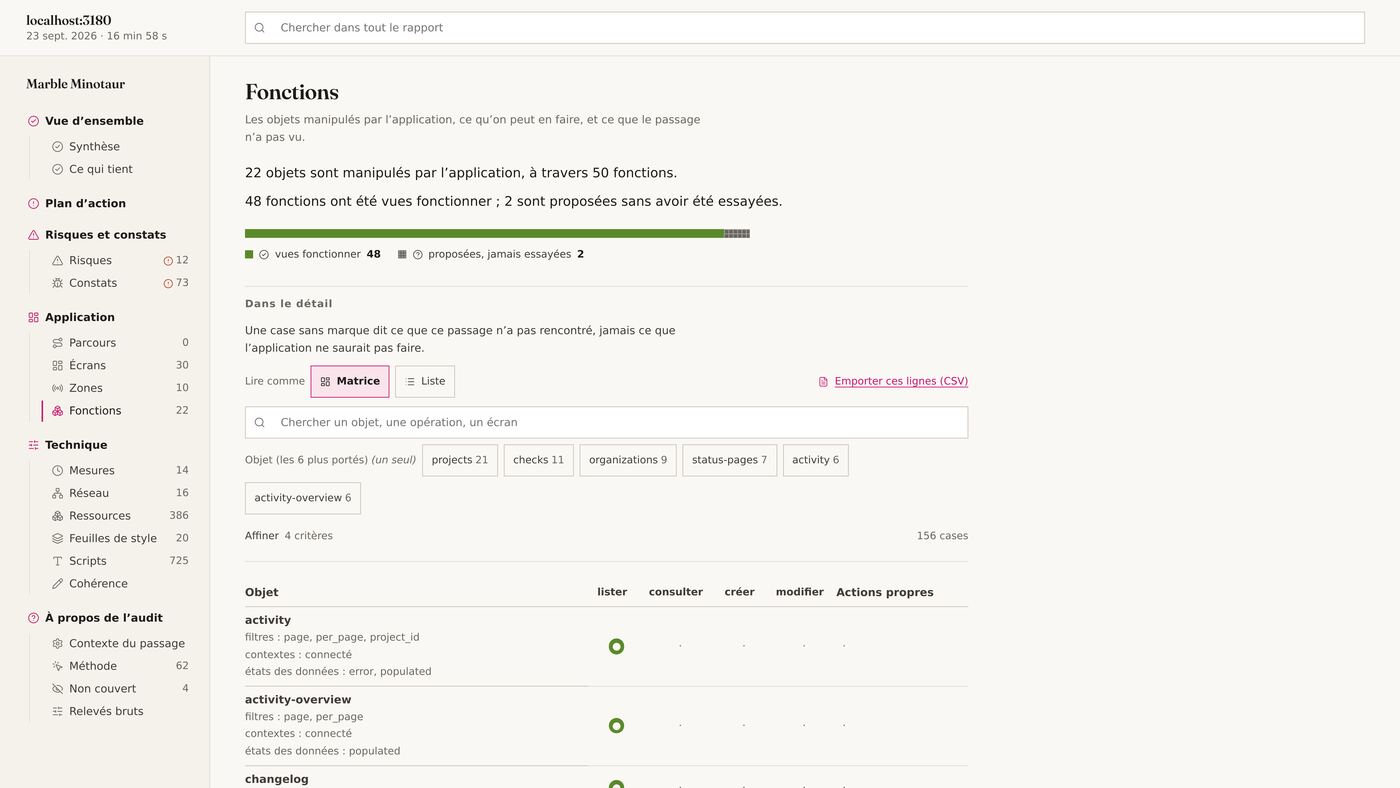
22 objects handled through 50 functions: list, view, create, edit, and each object’s own actions. 48 were seen working, 2 are offered by the interface without having been tried.

An empty cell says what this run did not come across, never what the application cannot do. The table exports, so you can hold it against your test coverage.

Functions tab: matrix of the 22 objects and their operations, 48 of 50 seen working
→ Screens

“Where does it drag?”

Every screen, its time and its defects.

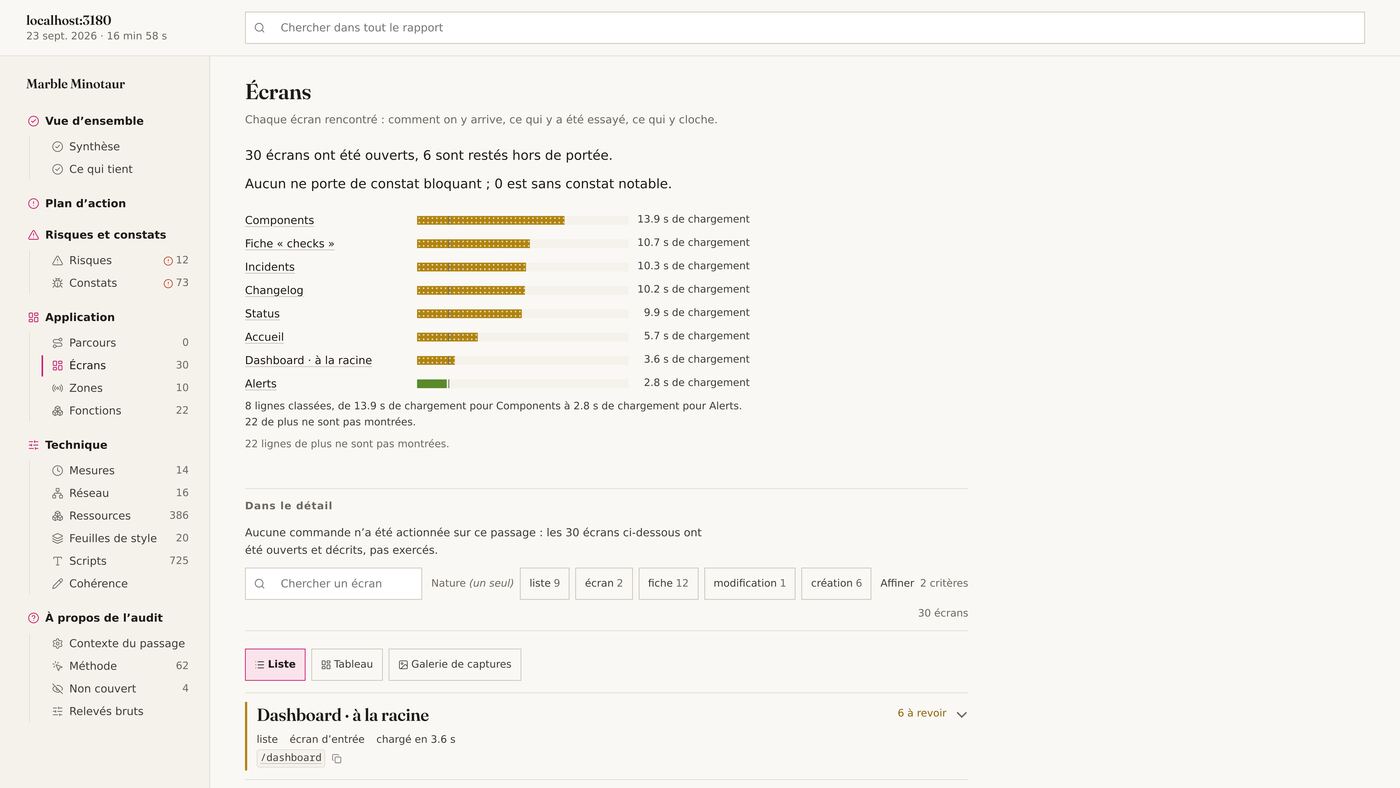
Screens ranked from slowest to fastest, each with its annotated screenshot, its three sizes, the commands tried and what is wrong there. Here, five screens take more than nine seconds to load.

  • Components 13.9 s
  • “checks” detail 10.7 s
  • Incidents 10.3 s
  • Changelog 10.2 s
  • Status 9.9 s
  • Alerts 2.8 s
Screens tab: screens ranked by load time, from 13.9 s for Components to 2.8 s for Alerts
→ Measurements

“Is it fast?”

Every figure against its threshold.

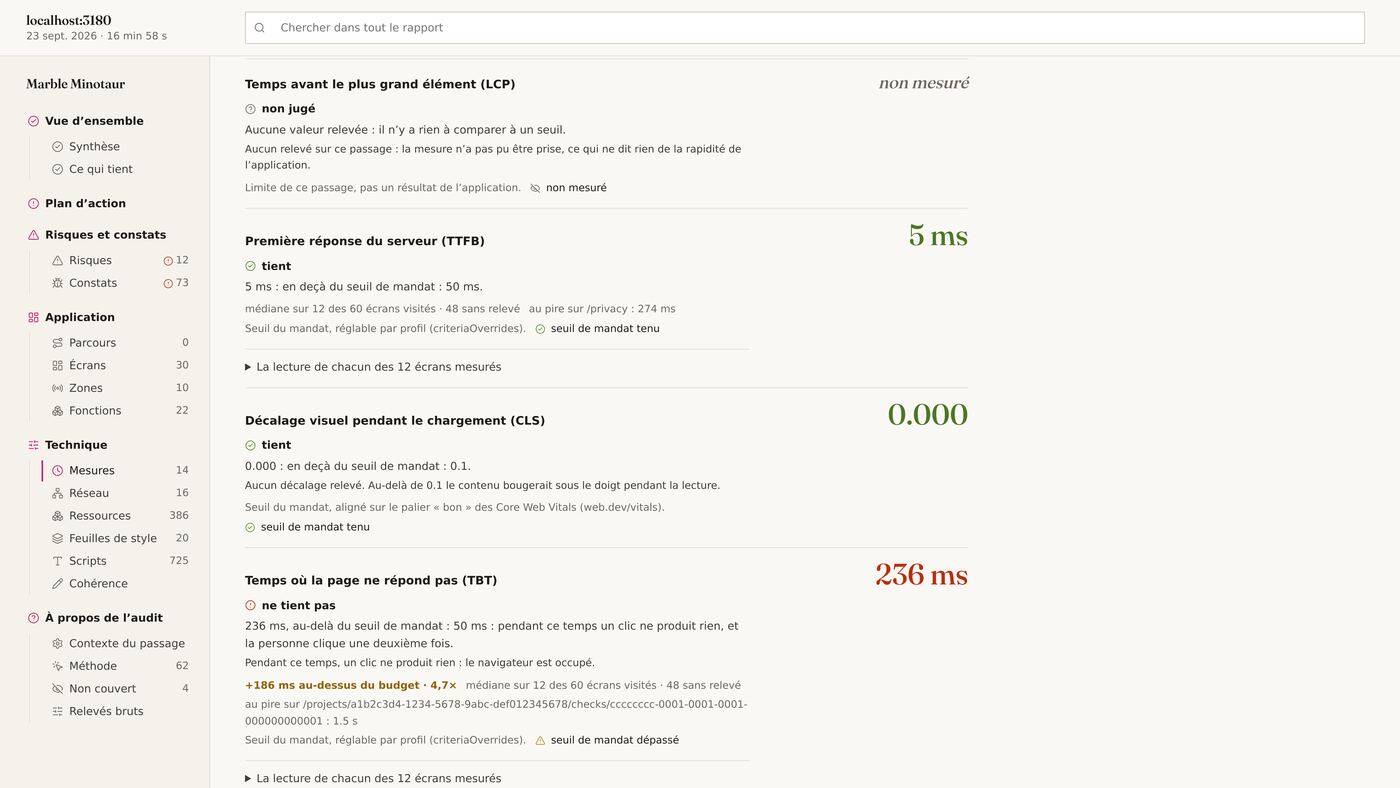
A measurement is only judged if it was taken. When it was not, the report writes “not measured” and says it is a limit of the run, not a result about the application.

does not hold 236ms page not responding, threshold 50 ms
holds 5ms first response, threshold 50 ms
not judged ? largest element: no reading
Measurements tab: LCP not measured, TTFB 5 ms holds, CLS 0.000 holds, TBT 236 ms does not hold
→ Journeys

“And what it did not see?”

What is missing, and what would fill it.

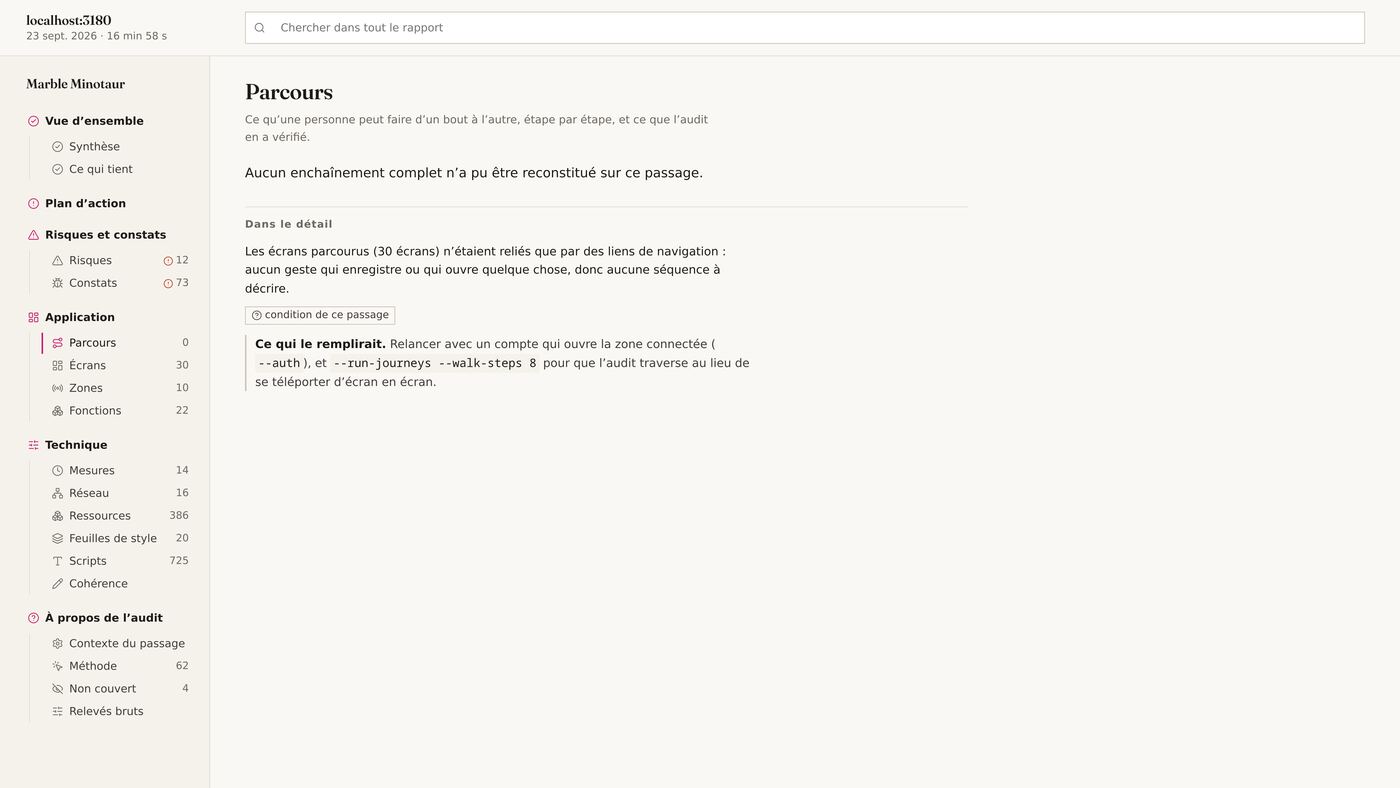
On this read-only run, no complete journey could be reconstructed. The tab does not stay silent: it says why, and which setting would fill it next time.

Journeys tab: no complete journey reconstructed, and what would fill it
“What would fill it”: run again with journey replay switched on.
→ 18

Eighteen tabs, one question each.

In four groups, from most read to most technical. You can stop after the first.

Read

  • Summary: the verdict, what it covers, what to open first
  • To do: fixes, ranked by what they solve
  • Risks: what threatens, and what it would allow
  • What holds: what was seen working

Understand the application

  • Journeys: sequences observed and replayed
  • Screens: every screen, captured and annotated
  • Zones: parts of the application and their rules
  • Functions: objects and operations, seen or only offered

Check in detail

  • Findings: every record, grouped by family
  • Consistency: calls compared with each other
  • Network: status codes, weight, formats, response times
  • Resources: scripts, styles, images, fonts
  • Measurements: every figure against its threshold
  • Change: comparison with the previous run

The audit itself

  • Outside view: what a signed-out visitor sees
  • Method: the catalogue, the settings, a glossary
  • Not covered: what this run could not judge, and why
  • Raw data: the original records, to check
→ exit

It goes where the others stop.

The journey only starts on request. Send me three things, you receive the report.

  • The address of the application, preferably a staging environment
  • An account a test account with ordinary user rights
  • The scope read only, or forms and clicks allowed
cedric@siliceum.com

What happens next

  1. You send me the address and the scope. The test account comes separately, never in the email.
  2. I run it and read the report before sending it to you.
  3. We go through it together, half an hour on a call, so your team knows where to start.

The first runs are free, walk-through included, for teams willing to tell me afterwards what the report was missing.